※ User Guide:
Frequently Asked Questions:
1. Q: How to use GPS-pPLM webserver?
A: First, you could find the prediction website in "WEB SERVER" page of GPS-pPLM. Second, enter UniProt accession number(s) or protein sequence(s) in fasta format, which starts with a '>' followed with protein/peptide name. Then, select the threshold and site type. We provided 6 residue type site predictors and 134 species-specific predictors. Just click the "Submit" button, wait a moment, you can get the prediction results of phosphorylation sites.
2. Q: How to choose the different prediction modules?
A:
We provide 3 modules of prediction for users. You can click check box at "WEB SERVER" page to change the online service mode or just click the following names:
(1) GPS-pPLM (Single residue type): Single residue prediction based on sequence features and transformer features.
(2) GPS-pPLM (Species-specific): Species-specific prediction based on sequence features and transformer features.
(3) GPS-pPLM (Comprehensive): Based on sequence features and transformer features for prediction, with additional annotations for quadratic structure and surface accessibility.
3. Q: How to read the GPS-pPLM results?
A:
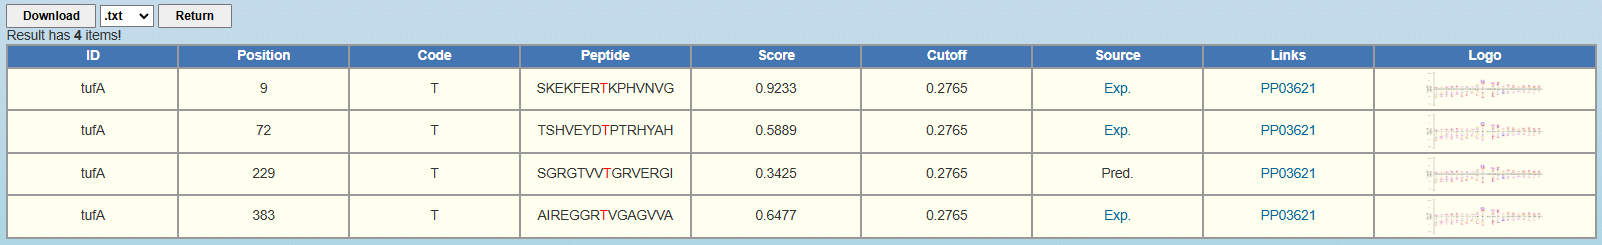
Here we use the Escherichia coli protein tufA as the example. After clicking "Submit", the prediction results of pT sites with medium threshold are shown as follows:
ID: The name/id of the protein sequence that you input to predict. Position: The position of the site which is predicted to be phosphorylated. Code: The residue which is predicted to be phosphorylated. Peptide: The predicted phosphopeptide with 7 amino acids upstream and 7 amino acids downstream around the modified residue. Score: The value calculated by GPS-pPLM algorithm to evaluate the potential of phosphorylation. The higher the value, the more potential the residue is phosphorylated. Cutoff: The cutoff value under the threshold. Different threshold means different precision, sensitivity and specificity. Source: Whether this phosphorylation site validated by experiment, "Exp." means YES, while "Pred." means NO. "Exp." links to the source site. Links: The corresponding dbPSP 2.0 page. Logo: The sequence logo of this phosphopeptide. 4.
Q: How to choose the cut-off
values and the thresholds? A:
Firstly, we calculated the theoretically maximal
false positive rate (FPR) for each predictor.
The three thresholds of GPS-pPLM were decided based
on calculated FPRs.For each predictor,
the high, medium and low thresholds were established
with FPRs of 5%, 10% and 15%.
5. Q: I have a few questions which
are not listed above, how can I contact the authors
of GPS-pPLM? A:
Please contact the responding author: Chi Zhang or Dr. Yu Xue for details.
<1>. The table of the GPS-pPLM results
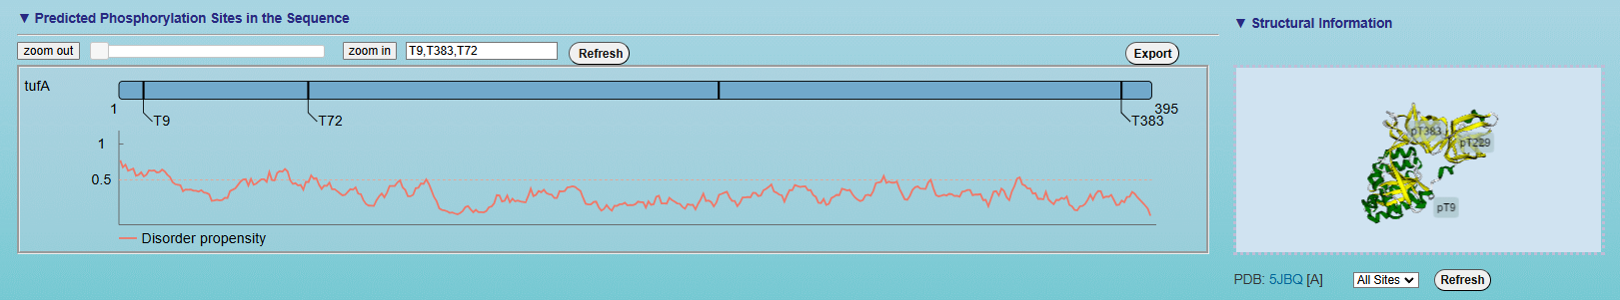
<2>. The visualization of default prediction
Left: The visualization for the positional distribution of the predicted site in protein sequence. By default, the sites with the highest 3 predicted scores are displayed. The visualization for protein disordered region predicted by IUPred
[PMID: 15955779]. Cutoff = 0.5, if score of prediction > cutoff, the residue is considered in disordered region.
Right:The 3D structure of the substrate labeled with predicted phosphorylation sites.
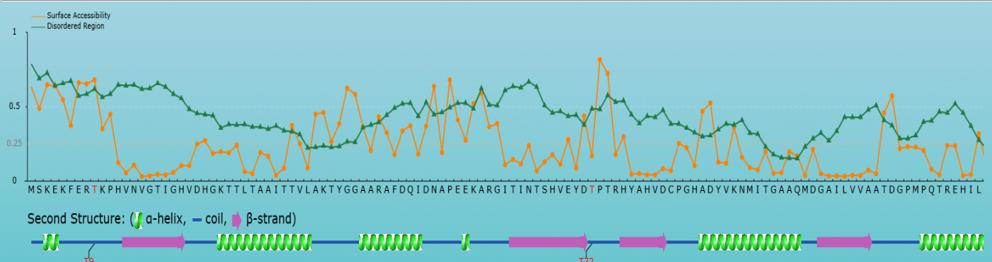
<3>. The visualization of comprehensive prediction
Top: The surface accessibility of amino acids and the protein disordered region were predicted by
NetSurfP ver. 1.1 (PMID: 19646261) and IUPred
(PMID: 15955779), respectively. The cutoff of disordered region prediction = 0.5, if score of prediction > cutoff,
the residue is considered in disordered region. The cutoff of surface accessibility prediction = 0.25, if score of prediction > cutoff, the residue is considered as surface exposed residue.
Bottom: The positions of the predicted phosphorylation sites were visualized in the protein sequence together with the secondary structure predicted by NetSurfP ver. 1.1 (PMID: 19646261).